Year 2020 impacted in many aspects of our lives both positive and negative ways. One good thing about this year for me was that I was pushed back to study something new due to WFH situation and to get the maximum out of the free time, resources and exam discounts. As a result, I started to polish my ad-hoc knowledge of cloud computing and dig little deeper into it. So far this year, I was able to certify in both OCI and Azure associate level and having a good time playing around with cloud services.

As a developer often working with on-prem applications (mostly IFS ERP in my situation), monitoring and troubleshooting is the most time consuming and hardest part of the job and of course it’s not fun when the system is down and all eyes on you. What if we can setup our own, cloud based monitoring system consist of cool dashboard visualizations, deep analytics and alarming system almost for free? Well, that’s what Azure Monitor is all about and what I like most is that the capability of building own monitoring system using the Azure tool set.
Many have misunderstood that Azure Monitor is a solution which is only capable of monitoring resources and applications deployed in Azure stack. This is completely wrong interpretation and Azure Monitor can be described as all-in-one, logging and monitoring solution for cloud or non cloud based applications. It provides built-in support for Azure resources, alerts, APIs for 3rd party integrations and advanced analytics capabilities.
Azure Monitor is still not quite there yet as a full stack APM solutions but it has very interesting set of features which can be used to build completely to almost free cloud based APM solution.
Azure Monitor has variety of data sources and the list is getting longer every day. Besides all the data source options, what interested me most is that data collection of custom logs via agent to Log Analytics workspace since it’s the easiest and most cost efficient option of onboard on-prem application to the Azure Monitor.
Building a monitoring solution with Azure Monitor custom logs compromise of three main steps.
- Defining a custom log and add log collection paths
- Write log analytics queries to analyse the data and build visualizations
- Manage alerts and setup notifications
Thinking About Cost…?

For Azure Monitor Log Analytics, you have to pay for data ingestion and data retention. With Pay-As-You-Go pricing, which is the default option, 5GB of log ingestion per month and data retention of 31 days is totally FREE. This means that if the total size of logs you wish to monitor with Azure is less than 5GB per month and you are okay with 31 days retention, you can create totally free Monitoring solution of your own.
There’s no charge for visualizations and you can build dashboards or workbooks to visualize data and share with others.
There’s a cost involved in Alerts and it’s based on the type and number of signals it monitors. In the context of logs, cost varies from $0.50 to $1.50 per log monitored per month and 1000 Emails and Push notification (to Azure Mobile App) are free as well. More details about the pricing can be found here.
Prerequisites
It primarily requires an Azure account and setting up of Log Analytics workspace with agent to get things started. If you need any help regarding those, please check the Azure documentation links below.
- Sign up for Azure Account
- Setting Log Analytics workspace
- About Log Analytics Agents
- Install Log Analytic agent (Windows) / Linux
Azure Monitor Agent is the replacement of Log Analytics agent. By the time this post was written it's in preview and it might be required to switch to it in future.
Custom Logs
A custom log can be any log file written to disk by an application deployed in cloud or non cloud environment. There are few rules that you have to be careful such as log rotation, encoding and log format. More information about custom logs can be found in Azure documentation.
Azure Monitor collects new entries from each custom log approximately every 5 minutes. Custom log collection requires that the application writing the log file flushes the log content to the disk periodically. This is because the custom log collection relies on filesystem change notifications for the log file being tracked.
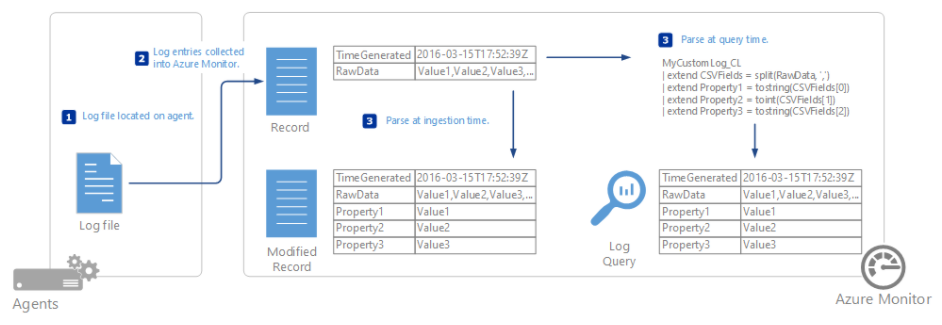
Each collected log record consist of two important properties
- TimeGenerated – Date and time that the record was collected by Azure Monitor
- RawData – Contents of the log entry. This can be parsed using different operators in the Kusto query language.
Let’s Get Started…
Before start, you should check the your application logs and decide which log files should be monitored. There are no limitations for custom logs bounding rather than the criteria defined by Microsoft but the log entries should be able to parse by some sort of a pattern in order to get meaningful information out of it. Therefore, understand your logs and decide which log files are suitable for monitoring.
sitestat is a small Windows utility I created to log website status and connectivity details. In this post, I will be using the log created by sitestat to visualize the web site performance in near-real time. You can use any application log of your choice and same concept will apply regardless of the application or the log.
Configure sitestat
First of all, download and configure sitestat in your PC or in a server. Create a windows schedule task to periodically collect site stats. Log entry of the sitestat should looks like below.
2020-11-11 18:00:00;https://dsj23.me/;200;0.110000;0.141000;0.188000;0.485000;0.829000;
2020-11-11 18:15:00;https://dsj23.me/;200;0.109000;0.140000;0.203000;0.593000;0.843000;
2020-11-11 18:30:00;https://dsj23.me/;200;0.016000;0.031000;0.094000;0.375000;0.578000;
It has the timestamp, website URL, status and time to connect in details, each separated by semi-colon. Entry separation is important since extracting the data from is mostly depending on that and you need to identify the log pattern and what data need to be extracted.
Now it’s time to start the setup from Azure side.
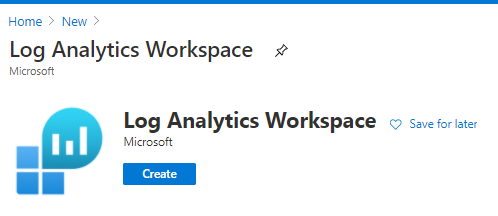
Create Log Analytics Workspace
Login to the Azure Portal and search for Log Analytics Workspace under Create a resource.
Details you have to enter are standard and straightforward and hope it doesn’t need any explanation. As a rule of thumb, it’s good to create a new resource group to keep everything related to Log Analytics. In the Next page, select Pay-as-you-go Pricing tier.
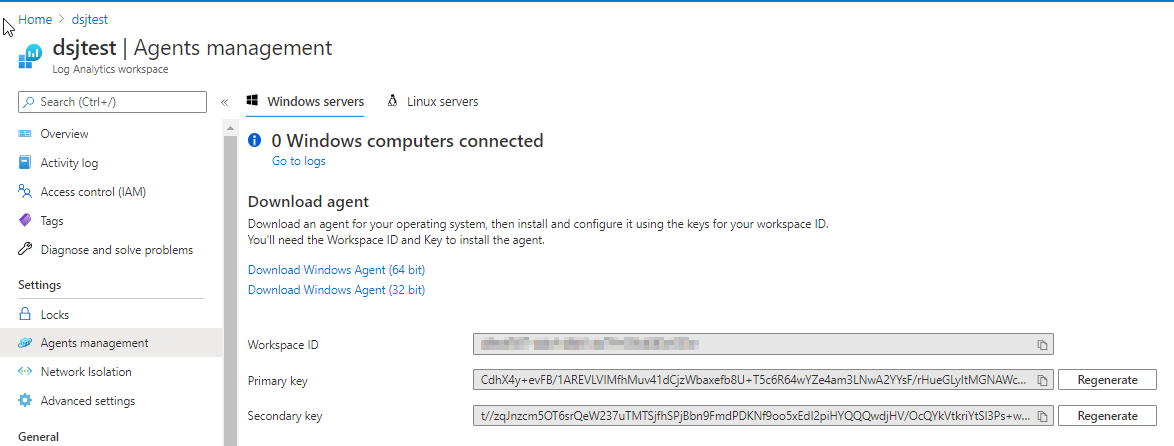
Download and setup Log Analytics Agent
Open the Log Analytics workspace created in above step and go to Agents management under Settings. Download the Windows/ Linux agent by clicking the link and start installation.
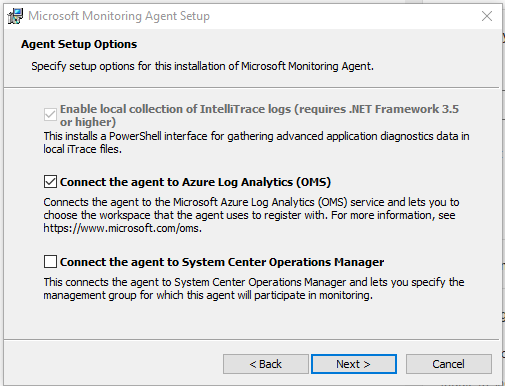
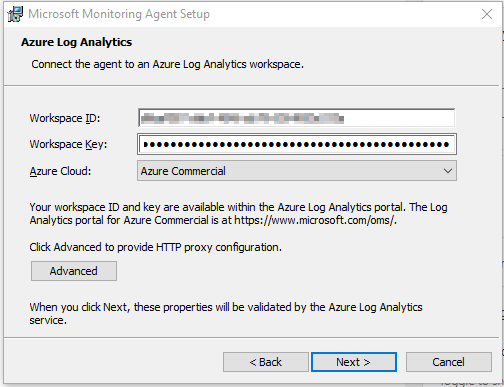
In the setup wizard, choose Connect the agent yo Azure Log Analytics (OMS)
In the next step, provide the workspace ID and Primary key which displayed in the Azure Portal Agent Management blade.
More Installation Options can be found in the Azure Documentation.
Verify Agent Activity
Now switch to Log analytics workspace in Azure Portal and go to the Logs
Write following query to check Agent Heartbeat
Heartbeat
| where Category == "Direct Agent"
| where TimeGenerated > ago(30m)
In the search results returned, you should see heartbeat records for the computer indicating it is connected and reporting to the service.

Configure Custom Log
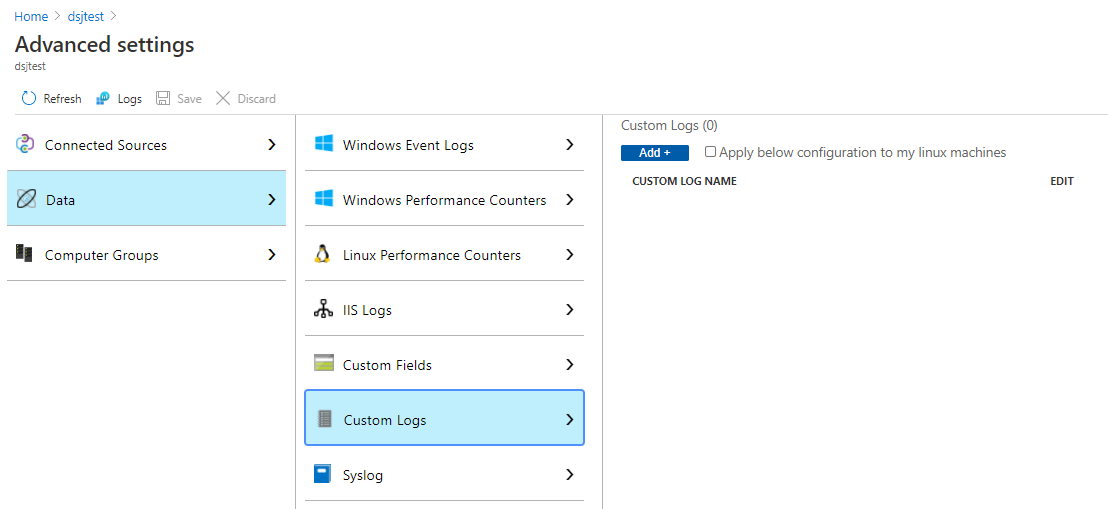
Open the Log Analytics workspace created in above step and go to Advanced Settings under Settings. Click Data/ Custom Logs / Add+ to add a new custom log
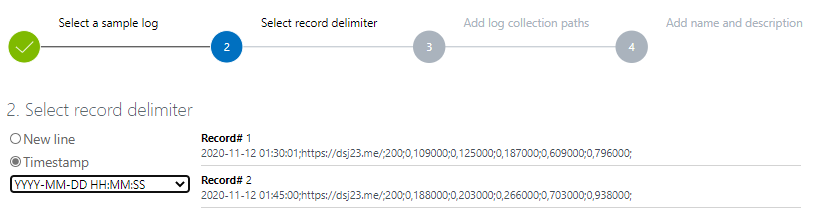
TimeGenerated property of each log entry is dependent on the record delimiter. If you chose New line, it will have the date and time that the record was collected by Azure Monitor. If you use Timestamp, then it will have that value collected from the log.
Choose the log file created by sitestat as the sample log and in the next step, choose Timestamp and select the timestamp format as below.
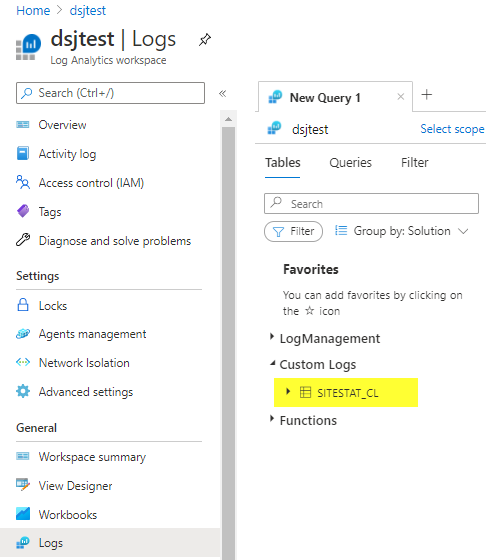
Add log collection path and name to your custom log. Note that custom logs are suffix with _CL.
Now your custom log should be available in the Logs under Custom Logs. It would take up to one hour to first see the data on the log so relax if you don’t see any data just after creating the custom log😉.
Among the fields, TimeGenerated and RawData are the fields which interests us most. Note that the TimeGenerated is in UTC unless it’s manually specified.
Extract Log Data
Now everything in place to move forward with building queries in Log Analytics to extract data from the log.
You can build deep dive analytics with log analytics queries, check Azure Documentation for details.
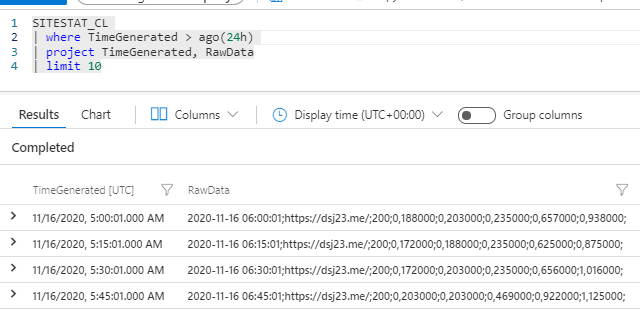
SITESTAT_CL
| extend decimalFixRawData = replace(@',(\d+)', @'.\1', RawData) // fix to change the decimal format from comma to dot
| extend parsedData = split(decimalFixRawData, ';')
| extend url = tostring(parsedData[1])
| extend status = toint(parsedData[2])| extend dns_lookup = todouble(parsedData[3])
| extend tcp_handshake = todouble(parsedData[4])
| extend ssl_handshake = todouble(parsedData[5])
| extend wait = todouble(parsedData[6])
| extend data_transfer = todouble(parsedData[7])
| project TimeGenerated, url, status, dns_lookup, tcp_handshake, ssl_handshake, wait, data_transfer
Visualizing Data
There are several visualization options available with Azure Monitor. Quickest and easiest way is to build a chart from the tabular data and pinned to a dashboard. render operator in Azure Monitor has several basic visualizations which can be used and below example is a area chart of the connectivity timings.
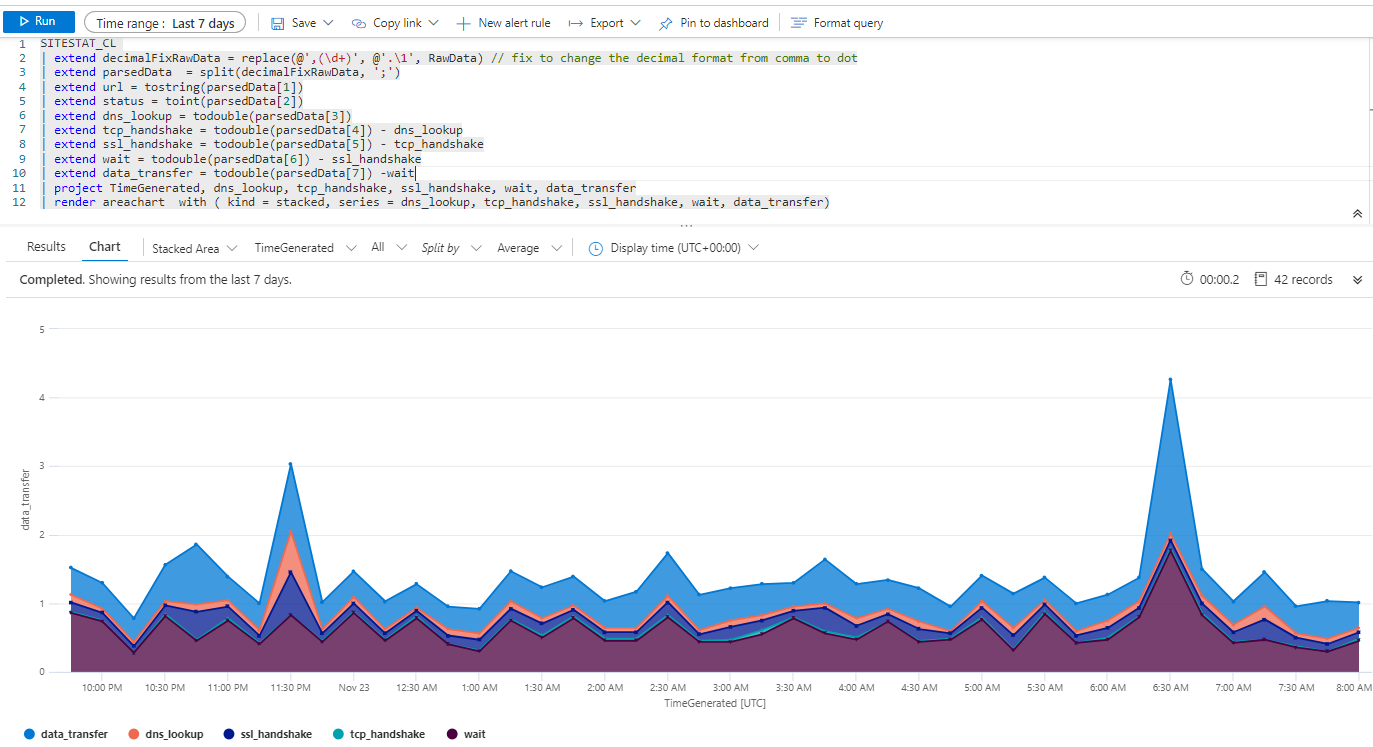
Log analytics query results and charts can be easily add to a dashboard by Pin to dashboard button in query worksheet. You can pin the query to a private dashboard or to a shared dashboard within the subscription. Below is a simple yet informative dashboard I created based on the connectivity timing data collected from our small cURL utility.

Azure Monitor has several other complex visualizations such as Workbooks, Power BI/Excel using M query and 3rd party tools like Grafana or you have the option of building your own client using REST api. More on Azure Monitor visualization options can be found in the Azure Documentation.
I will try to write a new post explaining the basics of Azure Monitor Workbooks and Grafana but not promising anything at this moment: Trust me, Grafana is way cooler!
Setup Alerts
One essential component of a monitoring system is the alerts. It is important have the accurate alerts notified to the right person at right time in order to act fast. Best thing about Azure Monitor is that this is fully configurable so you can set the alert definitions and manage the notifiers.
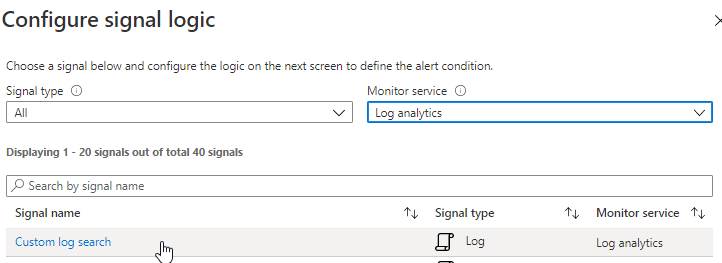
To add an alert, go to the Alert tile and + New alert rule

In the Alert rule section, select Custom log search as the signal name and Log analytics and Monitor service
In this example, I set up a alert rule to check website status
SITESTAT_CL
| extend decimalFixRawData = replace(@',(\d+)', @'.\1', RawData)
| extend parsedData = split(decimalFixRawData, ';')
| extend url = tostring(parsedData[1])| extend status = toint(parsedData[2])
| where status == 200| project TimeGenerated, url, status
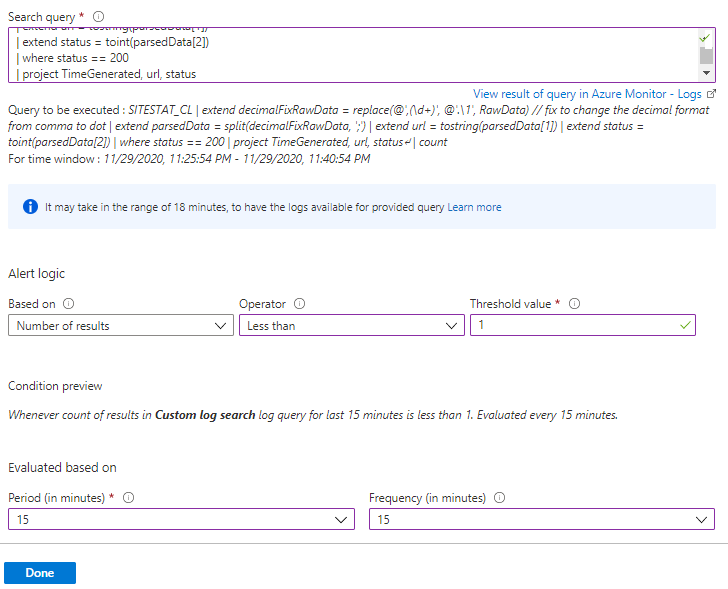
Creating Alert rule is straight forward and you can add different action groups to send email / SMS/ Azure push notifications or even call in some regions. More details about alert rules can be found in the Azure documentation.
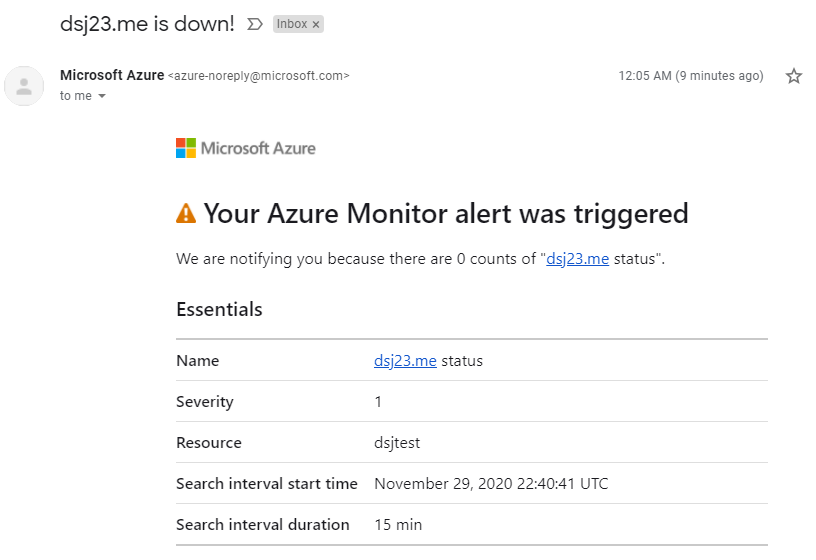
I’ve setup a email notification for this alert and this is what I got when the site was down.
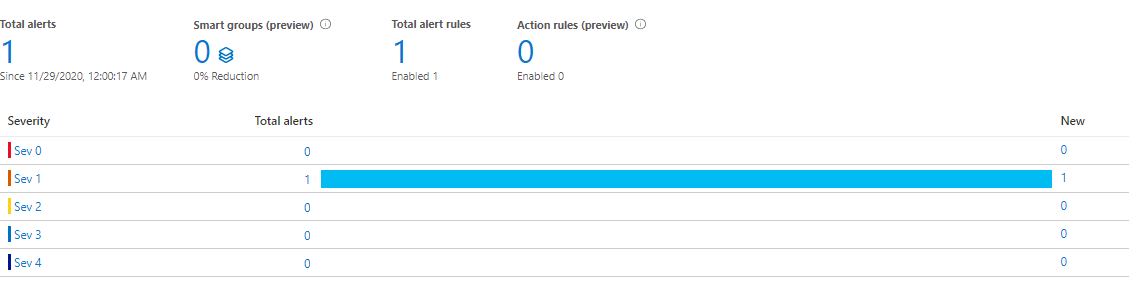
Triggered alerts are also can be found in the Azure portal as well as from Azure mobile app. You can also acknowledge and provide resolutions for the alerts.

Wrap up…
Hope this helped you to get a grasp about Azure Monitor and how it can be used for monitoring on-prem applications. Azure Monitor has lot of capabilities and there are many features which could be useful whether you are hosted on-prem or different cloud. Your thoughts and comments are sincerely welcome.


Thank you for your effort in explaining the details.